In trading, time is money in the most literal sense possible. If you get distracted you could miss a fantastic opportunity that was only possible a second ago. Every trader, from complete beginners to battle-hardened veterans, has the same issue: how to cut through the noise and make quick, confident decisions. That’s where MT4 indicators come in.
They’re not magic, but they’re the best we have as a compass in the often volatile and unpredictable financial markets. Some point up trends, others track momentum, and a few zone in on those make-or-break reversal points. If you’re looking for quick answers, you’ll want to know which ones give you the best shot at being ahead of the curve.
Why indicators matter in high-speed markets
The market does not wait. Currencies are moving in seconds, and extreme volatility takes even wise traders by surprise. Indicators are filters, stripping away distractions and giving a disciplined image of what is really happening.
Picture them as headlights on a nighttime drive. You may not always require them, and you might get along on your wits and sheer guesses alone—but wouldn’t you prefer an improved view of the road? Indicators don’t guarantee you’re going to do everything perfectly, but they nudge the odds in your direction.
The art of choosing the right indicator
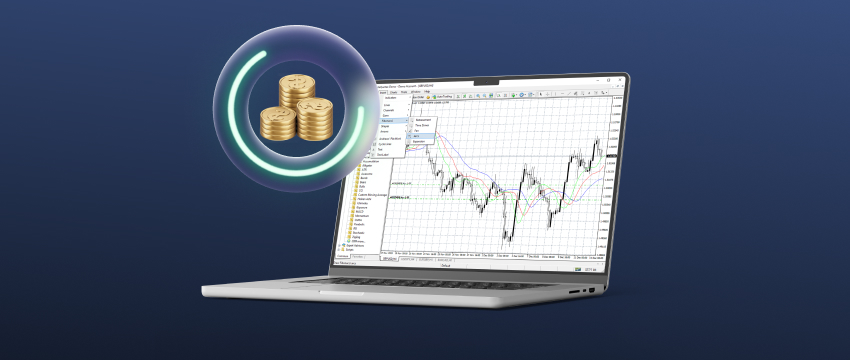
Here’s the trick: there are literally hundreds of indicators that come on MT4.
But all that doesn’t necessarily translate into quality. Loading your chart up with each and every flashy toy you can find usually ends up kicking you in the backside.
What’s actually the skill is choosing a small, supportive set of indicators that align with your trading method.
Are you a trend trader? You’ll need tools that set direction. A scalper? Rapid-response oscillators and volatility indicators will serve you better. The key is balance. You need to find MT4 indicators that don’t simply sing the same old song but offer different answers to the market.
Moving Average (MA): The classic guidepost
Moving averages are the bread and butter of technical traders. They smooth out all the crazy highs and lows, with a smooth line showing the general direction of price.
Simple Moving Average (SMA) vs Exponential Moving Average (EMA)
The SMA takes an average of a fixed number of prior prices and assigns equal weight to each one.
It’s not volatile but slow to react. The EMA, on the other hand, gives more relevance to the newer prices, so it’s much faster to react to new trends. Day traders favour EMA because it reacts so fast, while swing traders might favour SMAs for being stable.
Relative Strength Index (RSI): Detecting Momentum Swings
The RSI indicates the speed and the degree to which prices are travelling. It goes from 0 to 100, and those are the magic numbers.
How overbought and oversold zones work
If the RSI increases beyond 70, it generally indicates that buyers have overbought. And if it crosses below 30, it suggests that sellers have oversold.
Either is not a guaranteed turning point, but both are warning flags that should be heeded. Used correctly, RSI warns traders of when momentum is losing its force.

MACD (Moving Average Convergence Divergence): Confirmation of trend in action
MACD is the perfect blend of momentum and trend-following. It is made up of two lines: the signal line and the MACD line, and a histogram displaying the difference between them.
Signal line and histogram explained
When the MACD line crosses over the signal line, the trade is bullish. Cross below, and the trade is bearish. The histogram provides further insight, not only for direction but also for the intensity of the move. They form one of the most reliable tools for verifying if a trend has real strength behind it, when combined.
Bollinger Bands
Bollinger Bands document market volatility and price of an asset by enveloping price within top and bottom bands off a moving average. These bands adjust with market volatility, widening during high volatility and narrowing during low volatility.
Squeezes and breakouts for quick entries
When the bands tighten, volatility has gone silent which indicates the calm before the storm. Traders watch these squeezes and wait to strike when price moves sharply. When the bands expand, it is a sign of greater volatility.
Traders use Bollinger Bands alongside other MT4 indicators to improve their understanding of the market and to determine overbought or oversold conditions as well as verify trend strength.
Stochastic Oscillator
The Stochastic Oscillator compares a closing price to its series of prices over a specified range and is extremely responsive to market reversals.
Why it works well in ranging markets
Unlike trend-oriented indicators, Stochastic truly excels in sideways markets. When price moves in a range between support and resistance, Stochastic signals when the market is losing its vigour.
More than 80 is typically overbought, and less than 20 is oversold. It’s not absolute, but it’s an excellent early warning system.
Fibonacci Retracement
Markets have memory, and Fibonacci retracement is an example of this. It’s based on the famous Fibonacci sequence, which shows up everywhere in nature, and, not so surprisingly, in price action too.
The 38.2%, 50%, and 61.8% retracement levels are magnets. Prices will stall or reverse around them after a strong move. These levels are charted by traders to determine likely entry and exit points.
Ichimoku Cloud
At first sight, the Ichimoku Cloud looks cluttered. But once you understand it, you discover that it’s similar to having five in one.
Clouds, baselines, and trend signals
The “cloud” itself highlights future support and resistance. The baseline shows the longer-term trend, while the conversion line points to shorter-term shifts. Add in leading spans, and you’ve got a panoramic view of the trading market.
Average True Range (ATR)
Some traders don’t worry about direction, but again some are aware that volatility is just as critical. And that’s where ATR comes in.
ATR won’t tell you if the market will go up or down, it will tell you how much it will move. Smarter traders use it for position sizing. Let’s say in a very volatile environment you trade smaller size to keep risk under control. It’s a tiny but significant change.
Parabolic SAR
The Parabolic SAR is as simple as indicators come. Dots appear above or below price, indicating if the trend is up or down.
If the dots reverse from one side to the other, it indicates a possible reversal. For active traders, that level of clarity is extremely valuable. It won’t get every move exactly right, but it makes decisions easy in a manner that only a few indicators can.
Pivot Points
If you’re a day trader, pivot points are your friend. They give you instant support and resistance levels that are worked out from the previous day’s price action.
Unlike prolonged chart analysis, pivot points give you a snapshot for the coming day. They tell you where price is most likely to resist, bounce off, or break through.
Volume Indicator
Price is just half the story. Volume is the other half. If price is moving on light volume, it’s suspect to traders.
Divergence is one good trick. As price moves up with decreasing volume, it tends to signal weakness in the move. When strong rallies are indicated by heavy volume, they yell conviction. It’s the difference between empty noise and genuine momentum.

Combining indicators without cluttering the chart
It’s easy to overload with indicators, thinking that more tools mean more information. In the real trading world, too many MT4 indicators only serve to confuse.
A clean chart with two or three cooperating indicators usually performs far better than a cluttered mess.
Common mistakes traders make with indicators
One of the biggest mistakes is applying indicators as crystal balls. They’re not. They’re MT4 indicators that point to probabilities, not certainties.
Another pitfall is to ignore the big picture, such as economic events, news, and sentiment which still carry influence. Indicators should support your strategy, not control it.
How to adapt indicators to different timeframes
A setup that works beautifully on a daily chart will create unlimited false signals on a 5-minute chart.
Short-term traders usually modify indicators for sensitivity, while long-term traders prefer smoother setups to eliminate noise.
Sizing your MT4 indicators to your timeframe is key to making them useful.
Turning indicators into action
Trading is not chance. It’s tools, preparation, and the self-control to apply them effectively.
The MT4 indicators that we’ve covered are not going to make you an overnight millionaire, but they will give you a sharper edge in the fast-paced universe of markets.
Use them and combine them wisely, and most importantly stay true to your process.
Disclaimer: This material is for general informational and educational purposes only and should not be considered investment advice or an investment recommendation. T4Trade is not responsible for any data provided by third parties referenced or hyperlinked in this communication.